Managing Technical Debt
First some Physics!
Second law of thermodynamics
According to the second law of thermodynamics the entropy of an isolated system never decreases; such a system will spontaneously proceed towards thermodynamic equilibrium, the configuration with maximum entropy. Systems that are not isolated may decrease in entropy, provided they increase the entropy of their environment by at least that same amount.
In layman’s terms, it means that any process that introduces changes into the system will only increase the disorder in the system, unless the disorder is passed onto the environment.
Technical Debt in Software Systems
The law of thermodynamics is equally true for software systems as well. Any change introduced into the software will increase the complexity and disorder in the system. If this disorder is not managed, it will lead to more disorder.
The measure of disorder in the system is termed as “Technical Debt”.
Whenever new code is introduced into the system, the Technical Debt increases. If the technical debt is ignored for too long, reducing it becomes almost impossible as time progresses as more and more functionality is crammed with tight deadlines.
What’s worse is that in most software companies, the stakeholders and management do not know this is happening. So, no time is set aside for reducing the technical debt.
A good indicator for management that the debt is increasing is when features are taking longer than ever before to be implemented or when fixing a defect results in many other defects being opened. From the developers point of view, the indicators are that code is abnormally of high complexity, in-flexible and you are unsure what components will break if you modify the code.
Measuring technical debt - SQALE Rating
In the previous section, we mentioned a couple of indicators that managers and developers could use to instinctively tell whether they are building up a huge technical debt.
However, in order to have a solution that is going to work long-term, there needs to be a more measurable indicator of technical debt.
Measurement of technical debt provides us two key aspects:
- Ability to identify technical debt in the code
- Ability to monitor the progress of reducing the technical debt
SQALE
SQALE stands for Software Quality Assessment based on Lifecycle Expectations. The SQALE method measures an application’s technical debt in terms of the time it will take to fix the issues.
Once the technical debt is calculated, a health rating based on SQALE density is given.
The SQALE density formula is : Remediation cost / Development cost
It is also the same as : Remediation cost / (Cost to develop 1 line of code x Number of lines of code)
SonarQube to the rescue
SonarQube is an open platform to manage code quality and track technical debt. It tracks the technical debt using the SQALE rating described previously. Because it integrates easily into any CI process, build softwares and repositories, you can get access to live data on your team’s technical debt.
SonarQube uses its own implementation of the SQALE model. Of course, it is configurable to use different models.
So, for instance, if there are 10000 lines of code, a technical debt of 20 days and each line takes 0.01 days to implement, the scale density would be : 20/(0.01 x 10000) = 0.2
The below listing gives a sample SQALE density and their mapping to SQALE Ratings. In our example, the SQALE rating would be B. If the debt is less than 10% of the time that has already gone into the application, the rating is A.
<=0.10 the rating is a A
.11 to .2 the rating is a B
.21 to .5 the rating is a C
.51 to 1 the rating is a D
anything over 1 is an E
It also does a lot more than just measure technical debt. It covers the 7 axes of code quality:
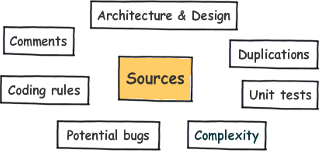
Image source: SonarQube.org
Not only it provides key insights into the various aspects of the code, it does so in a graphical manner using a web interface. This makes it a very useful tool not just for the developers, but also the management and other stakeholders.
Some key features of SonarQube are:
- Statistics related to code are displayed at the file, module, project or portfolio level.
- Many Dashboards are available out of the box, each displaying different types of statistics.
- Identifies and reports the Seven deadly sins of developers – Duplications, Coding standards, Lack of coverage, Potential bugs, Complexity, Documentation and Design.
- Numerous languages are supported(at the time of writing this post, it was 21).
- Time Machine – Past statistics and the change over the period of time is available. This lets us monitor progress.
- Pre-Commit Check and Quality gates. The check-in or the build can be made to fail if the code quality is not up to the expected standard. The Quality gates is completely configurable. You can decide at what levels the build should be marked as failed.
- Huge range of plugins available to extend the functionality of SonarQube.
A live demo of SonarQube is available at http://nemo.sonarqube.org/